Apache
The Apache Network Integration provides real-time visibility into your team’s server performance and statistics. This integration is useful for teams that want to understand the number of requests made to your servers, workers in each state, cumulative server traffic, and much more.
The Apache Network Integration works by ingesting and displaying data associated with the requests from clients and their corresponding responses back from the Apache Web Server. For example, server data is collected when a user makes a request to a web page and the corresponding response sends the requested components of the page back to the user.
For more information on the Apache Integration, navigate to the Apache Demo Project Repository.
Prerequisites#
1 MW Host Agent#
Middleware Host Agent (MW Agent) v1.6.1+ must be installed on your local machine. To install the MW Agent, see our Installation Guide.
2 Apache Web Server#
Apache Web Server v2.4+. To install the latest Apache Web Server Version, navigate to the Apache HTTP Server Project.
Setup#
Step 1: Enable Status Support#
Gather server statistics by enabling the Apache Status Module. Add one of the following code snippets to your httpd.conf configuration file to whitelist your IP address or the host-agent and scrape data from the Apache Server:
<Location "/server-status">
    SetHandler server-status
    Require ip <x.x.x.x>
</Location>
<Location "/server-status">
SetHandler server-status
Require host <example.com>
</Location>Step 2: Access Integrations#
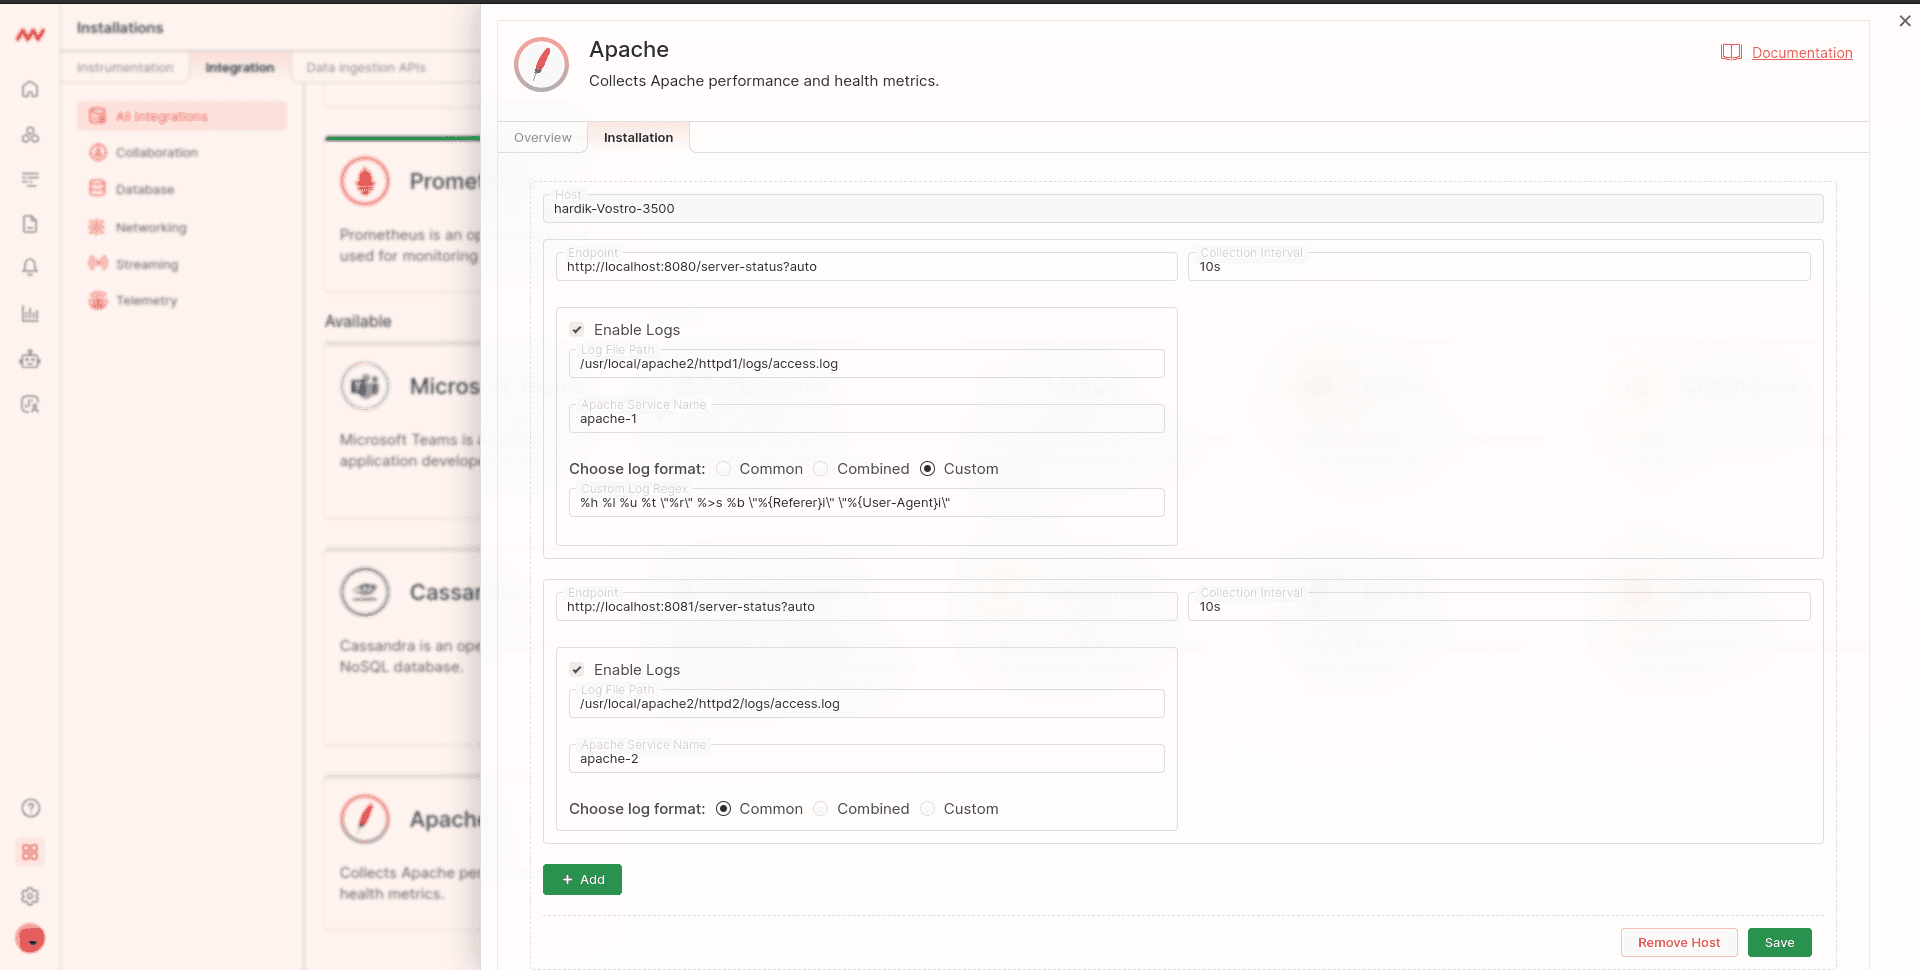
Log in to Middleware, navigate to the Installations Page in the bottom left corner, select Integrations and click Apache:
Step 3: Web Server Host#
To configure the integration of your Apache Web Server with our platform, follow these steps:
Enter Server Details:
- Endpoint: Provide the endpoint URL of the server status.
- Collection Interval: Specify the interval at which telemetry data is collected.
Enable Log Parsing (Optional):
- If you wish to enable log parsing, check the Enable logs checkbox.
- Log File Path: Enter the path to the Apache server's log file.
- Service Name: Provide a unique service name to identify and display logs.
- Log Format: Choose one of the following options for the log format:
- Common: Standard log format available in Apache.
- Combined: Extended log format available in Apache.
- Custom: Select this option if you need a custom log format.
- Custom Log Format Input: If you select the custom option, an input box will appear. Enter your custom log format according to Apache's log format specifications.

Visualize Your Data#
Default Apache Dashboard#
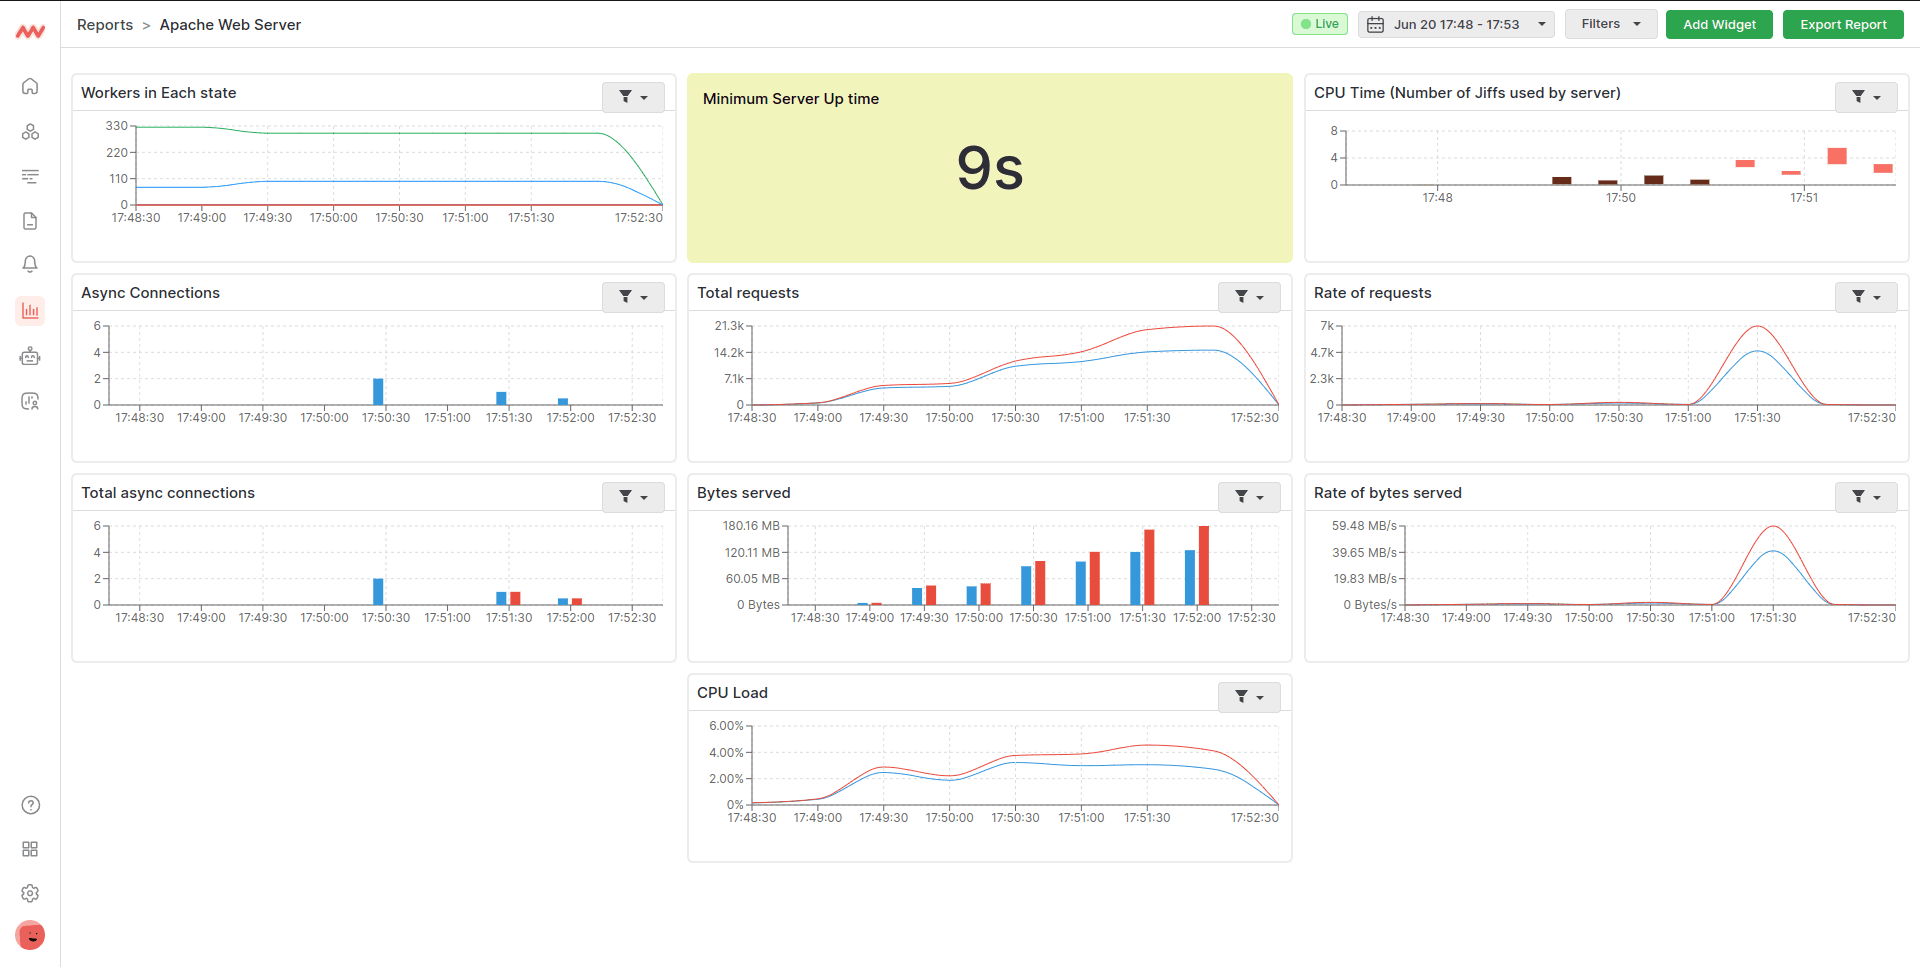
Quickly access your Apache data with Middleware’s default Apache dashboard. Navigate to the Dashboard Builder and select the Apache Web Server Dashboard:

Create Apache Widget#
All Apache-related data is accessible in our widget builder through apache.* metrics. See below for a comprehensive list.
Metrics collected#
| Metric | Description |
|---|---|
apache.uptime | Amount of time server has been running in seconds |
apache.current_connections | Number of active connections currently attached to the HTTP server |
apache.workers | Number of workers currently attached to the HTTP server |
apache.requests | Number of requests serviced by the HTTP server per second |
apache.traffic | Total HTTP server traffic |
apache.cpu.time | Number of jiffs used by a process in a given category |
apache.cpu.load | Current load of the CPU |
apache.load.1 | Average server load within the last minute |
apache.load.5 | Average server load within the last 5 minutes |
apache.load.15 | Average server load within the last 15 minutes |
apache.request.time | Total time spent handling requests |
apache.scoreboard | Number of workers in each state |
apache.conns_async_closing | The number of asynchronous closing connections. |
apache.conns_async_keep_alive | The number of asynchronous keep alive connections. |
apache.conns_async_writing | The number of asynchronous writes connections. |
apache.max_workers | The maximum number of workers apache web server can start. |
apache.bytes_per_sec | Served bytes per second |
apache.requests_per_sec | Incoming requests per second |
Host Configuration#
| Input Field | Description |
|---|---|
endpoint | URL of the HTTPD status endpoint |
collection_interval | Interval at which telemetry data is collected (default: 10 seconds) |
Enable logs | Checkbox to enable log collection and parsing |
Log file path | Path to the Apache server's log file (only if logs are enabled) |
service name | Unique service name for identifying/displaying logs (only if logs are enabled) |
log format | Log format as per Apache's log format specifications (Select one out of three options: Common, Combined, Custom; only if logs are enabled) |
Custom log format | Custom log format as per Apache's log format specifications (only if custom log format is selected) |
Next Steps#
- How to Create Alerts
- Dashboard Basics & Customization
- Custom Telemetry Ingestion
- Getting Started With Real User Monitoring (RUM)
- Data Ingestion APIs
Need assistance or want to learn more about Middleware? Contact our support team at [email protected] or join our Slack channel.