Redis Integration
Track Redis performance and health metrics (commands/sec, CPU, memory, keyspace, replication, I/O) in Middleware.
Prerequisites#
- Install the Middleware Host/Infra Agent on the machine that will collect metrics.
Setup#
1 Enter Redis connection details#
Have your Redis connection details ready: host, port number, and service name. You will enter these in the integration form (Step 3).
A quick reachability check from the Agent host helps before enabling the integration:
1# Plain TCP
2redis-cli -h <redis-host> -p <port> PING
3# TLS (example using a CA file)
4redis-cli --tls -h <redis-host> -p <port> --cacert <path_to_certificate> PING
Expect PONG if the server is reachable and the credentials/certs are valid.
2 Access Integrations#
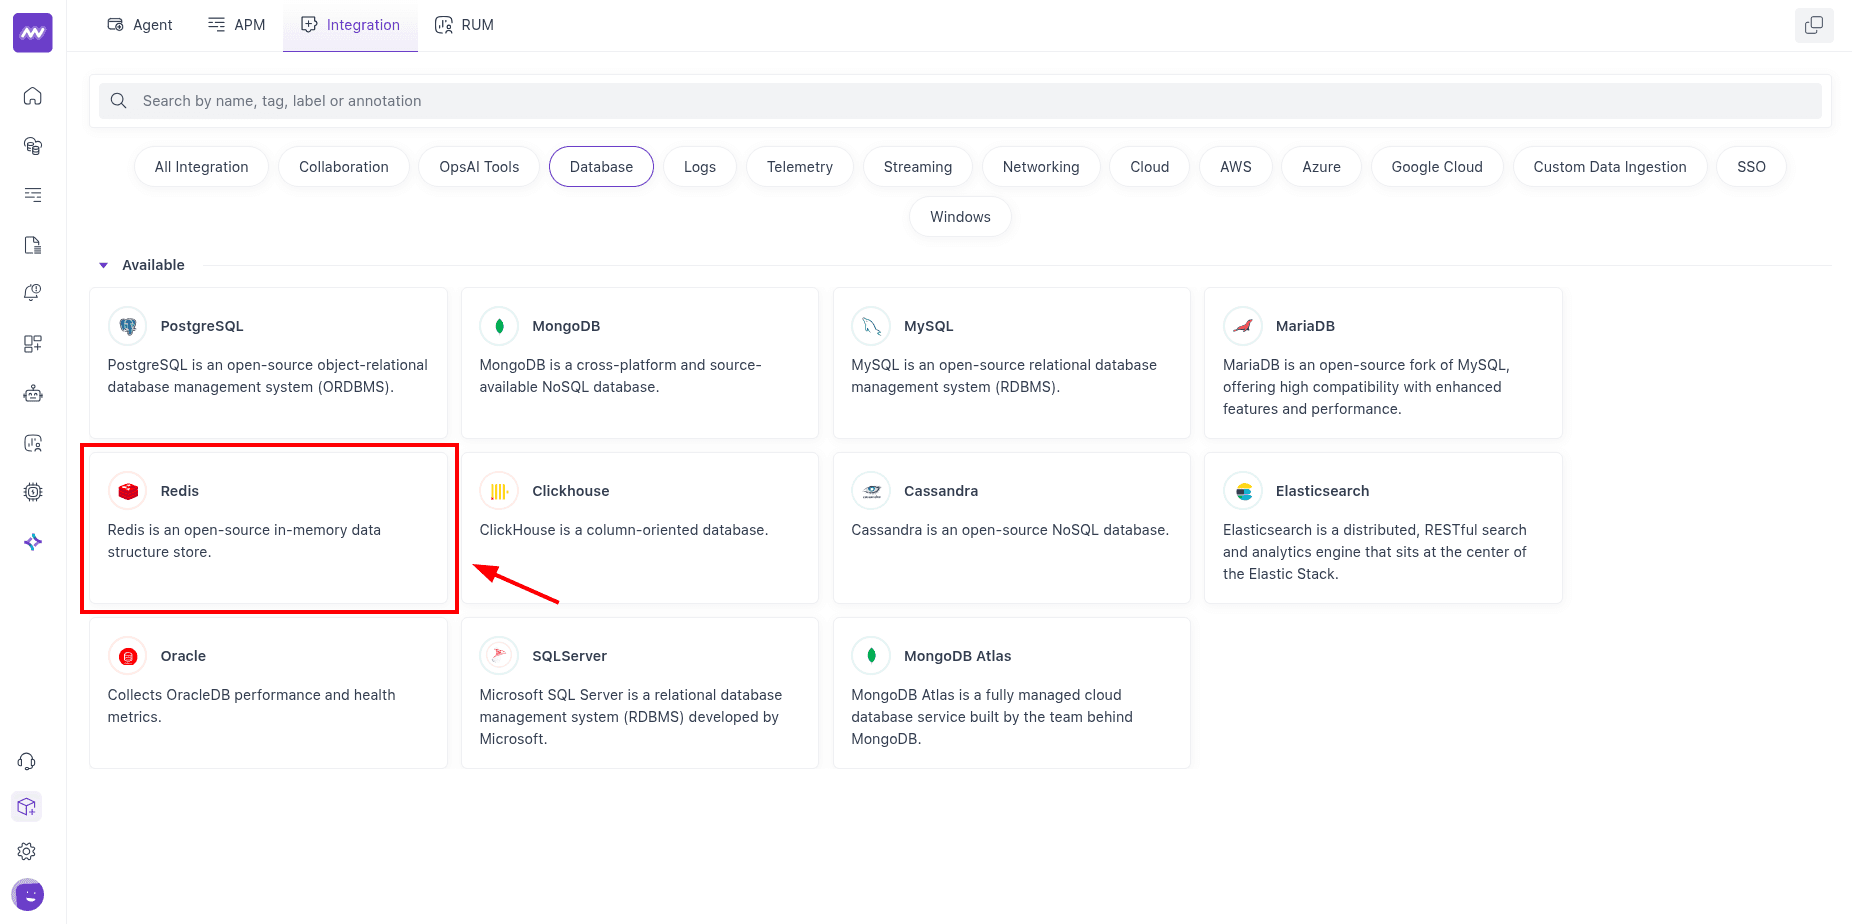
In Middleware, open Installations → All Integrations → Redis.
3 Enable Integration#
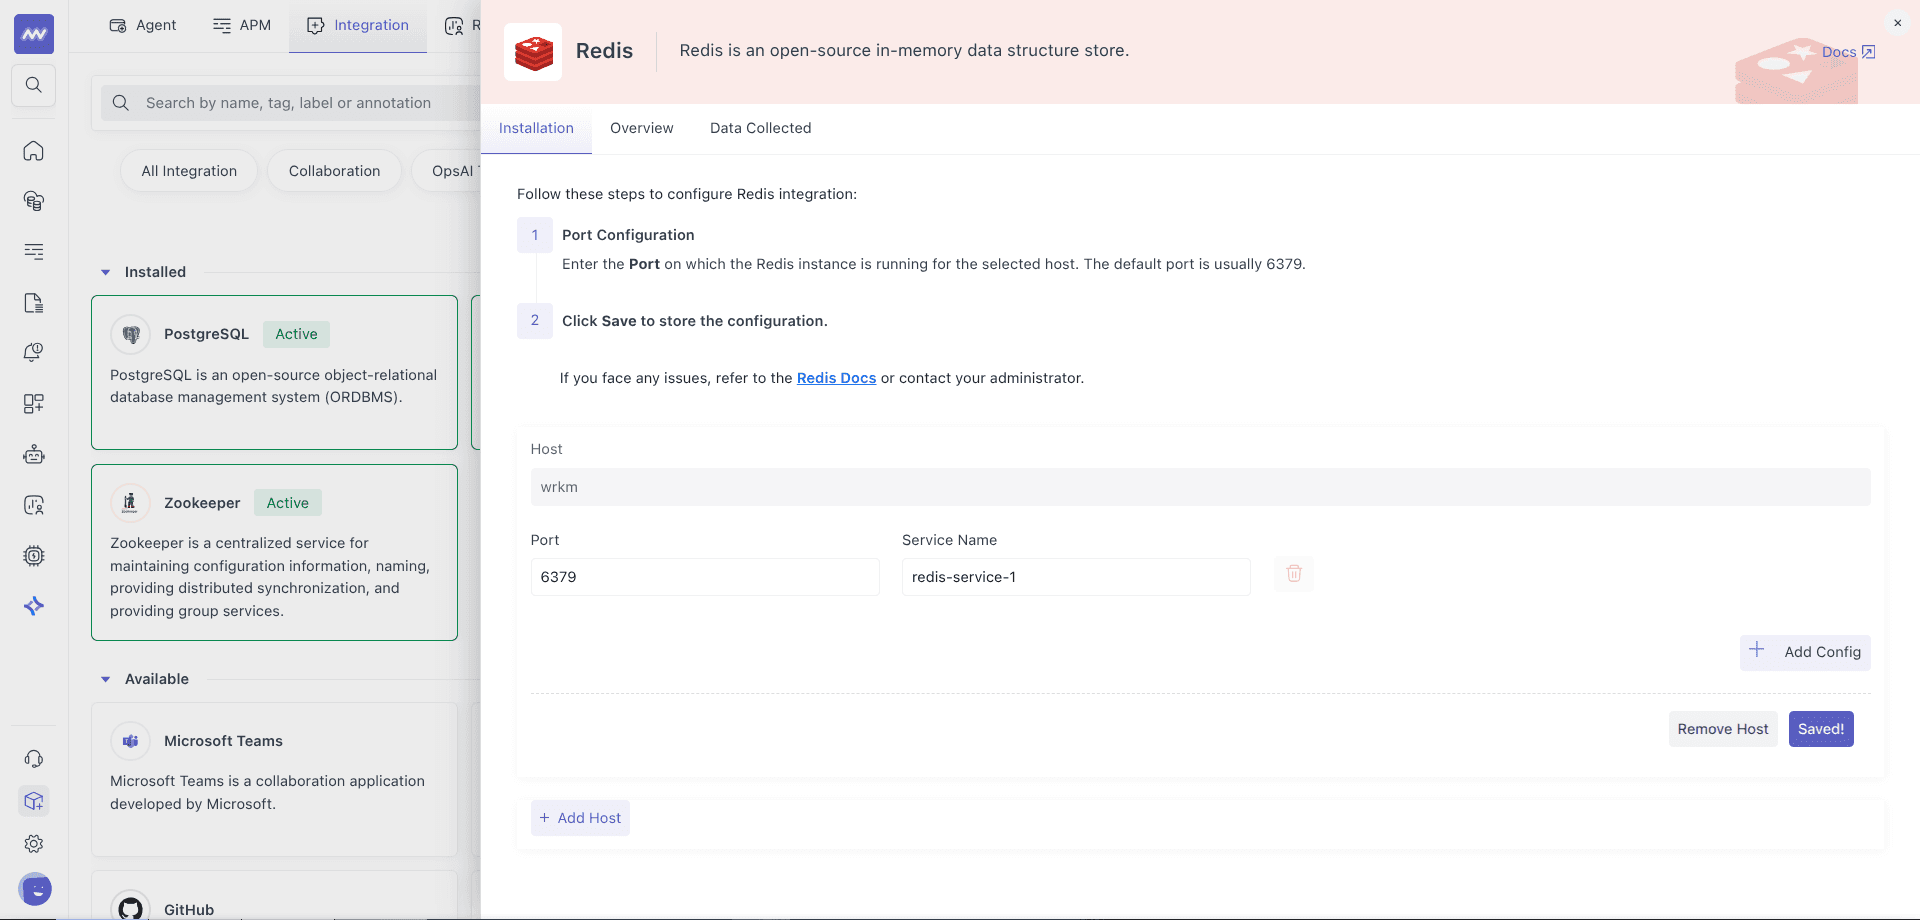
Select the host from the dropdown of Agent hosts, enter the port number and service name, and Save.
Visualize Analytics#
- A default Redis dashboard appears in Dashboard Builder after setup.
- To add custom charts, choose Add New Widget →
redisto browse available metrics.
Alerts#
Create alerts on any Redis metric: choose Detection Method: Database, Database Type: Redis, pick a metric, and set your conditions.
Metrics Collected#
| Metric | Description |
|---|---|
redis.maxmemory | Configured maxmemory value |
redis.role | Node’s role |
redis.cmd.calls | Total number of calls for a command |
redis.cmd.usec | Total time for all executions of this command |
redis.uptime | Number of seconds since server start |
redis.cpu.time | System CPU consumed since start |
redis.clients.connected | Client connections (excludes replica connections) |
redis.clients.max_input_buffer | Largest input buffer among current clients |
redis.clients.max_output_buffer | Longest output list among current clients |
redis.clients.blocked | Clients pending a blocking call |
redis.keys.expired | Total key expiration events |
redis.keys.evicted | Keys evicted due to maxmemory |
redis.connections.received | Connections accepted by the server |
redis.connections.rejected | Connections rejected due to maxclients |
redis.memory.used | Total bytes allocated by Redis |
redis.memory.peak | Historical max bytes consumed by Redis |
redis.memory.rss | Bytes allocated from operating system |
redis.memory.lua | Bytes used by the Lua engine |
redis.memory.fragmentation_ratio | Ratio between memory.rss and memory.used |
redis.rdb.changes_since_last_save | Number of changes since latest dump |
redis.commands | Number of commands processed per second |
redis.commands.processed | Total commands processed |
redis.net.input | Bytes read from the network |
redis.net.output | Bytes written to the network |
redis.keyspace.hits | Successful key lookups |
redis.keyspace.misses | Unsuccessful key lookups |
redis.latest_fork | Duration of latest fork (µs) |
redis.slaves.connected | Number of connected replicas |
redis.replication.backlog_first_byte_offset | Master offset of the replication backlog buffer |
redis.replication.offset | Current replication offset |
redis.db.keys | Number of keyspace keys |
redis.db.expires | Keys with expiration |
redis.db.avg_ttl | Average key TTL |
Troubleshooting#
- Integrations menu is missing: Ask an admin to grant your role Installation permissions in Settings.
- Agent can’t reach Redis: Test from the Agent host:
redis-cli -h <host> -p <port> PING(or add--tls --cacert <ca>for TLS). You should getPONG. Fix DNS/firewall/port or credentials if it fails. - Clustered/replicated setups show only one node: Add each node you want monitored (metrics are per instance/endpoint). You can sanity-check per node with
redis-cli INFOor sectioned calls likeINFO replication.
Need assistance or want to learn more about Middleware? Get in touch with us via our Contact Us or join our Slack channel.
What did you think of this content?