Kubernetes Auto-instrumentation
Introduction
The auto-instrumentation feature is built on top of the The OpenTelemetry (OTel) Kubernetes Operator. It enables the agent to automatically detect and instrument all .NET, Java, Node.js, Python, and Go services. The auto-instrumentation feature allows you to:
- Automatically collect metrics from all applications (regardless of the language) across your cluster.
- Enable/disable instrumentation per namespace or application.
- Manage instrumentation through a user-friendly UI.
- Apply changes without manual configuration.
Prerequisites
1 Kubernetes Version
Kubernetes version 1.21.0 or above. Check with the following command:
Shell
kubectl version
2 Middleware Kubernetes Agent
Install the Middleware Kubernetes agent using these instructions. Check that the agent is installed with the following command:
Shell
kubectl get pods -n mw-agent-ns
Setup auto-instrumentation
You must have installed the Middleware Middleware’s Kubernetes Agent before setting up auto-instrumentation.
Installation
You can enable auto-instrumentation using either helm or bash.
You must install the cert-manager alongside the Operator. This is not be compulsory if you already have the cert-manager installed, or have alternative methods of generating certificates in your Kubernetes cluster. Choose either option that suits you below.
helm repo add jetstack https://charts.jetstack.io --force-update
helm install cert-manager jetstack/cert-manager --namespace cert-manager --create-namespace --version v1.14.5 --set installCRDs=true
helm repo add middleware-labs https://helm.middleware.io
helm install mw-auto middleware-labs/mw-autoinstrumentation \
--set mw.apiKey=<MW_API_KEY> \
--set mw.target=https://deofs.stage.env.middleware.io:443 \
--set clusterMetadata.name=<YOUR_CLUSTER_NAME> \
--namespace mw-autoinstrumentation \
--create-namespace
You can configure namespace inclusion/exclusion when installing the Helm chart:
a. Include specific namespaces:
--set webhook.includedNamespaces="{namespace1,namespace2}"Only the specified namespaces will be monitored for auto-instrumentation.
b. Exclude specific namespaces:
--set webhook.userExcludedNamespaces="{namespace1,namespace2}"All namespaces except the specified ones will be monitored (system namespaces are automatically excluded).
In most of cases, you will need to install cert-manager along with the Operator, unless you already have cert-manager installed or have alternative methods of generating certificates in your Kubernetes cluster.
MW_INSTALL_CERT_MANAGER=true MW_API_KEY="<MW_API_KEY>" bash -c "$(curl -L https://install.middleware.io/scripts/mw-kube-auto-instrumentation-install.sh)"
MW_API_KEY="<MW_API_KEY>" bash -c "$(curl -L https://install.middleware.io/scripts/mw-kube-auto-instrumentation-install.sh)"
You can configure namespace inclusion/exclusion using environment variables when installing script:
a. Include specific namespaces:
MW_EXCLUDED_NAMESPACES="namespace1,namespace2"
Only the specified namespaces will be monitored for auto-instrumentation.
b. Exclude specific namespaces:
MW_INCLUDED_NAMESPACES="namespace1,namespace2 "
All namespaces except the specified ones will be monitored (system namespaces are automatically excluded).
Also You can modify this auto-instrumentation file to customize OpenTelemetry settings.
kubectl apply -f https://install.middleware.io/manifests/autoinstrumentation/mw-otel-auto-instrumentation.yaml
Configuring Auto-instrumentation
Application Selection
Go to the "Choose Target Application" section in the Kubernetes agent installation screen:
- View automatically detected applications and their languages.
- Enable or disable instrumentation for specific applications.
- Use "Select All" to toggle instrumentation for all detected applications.
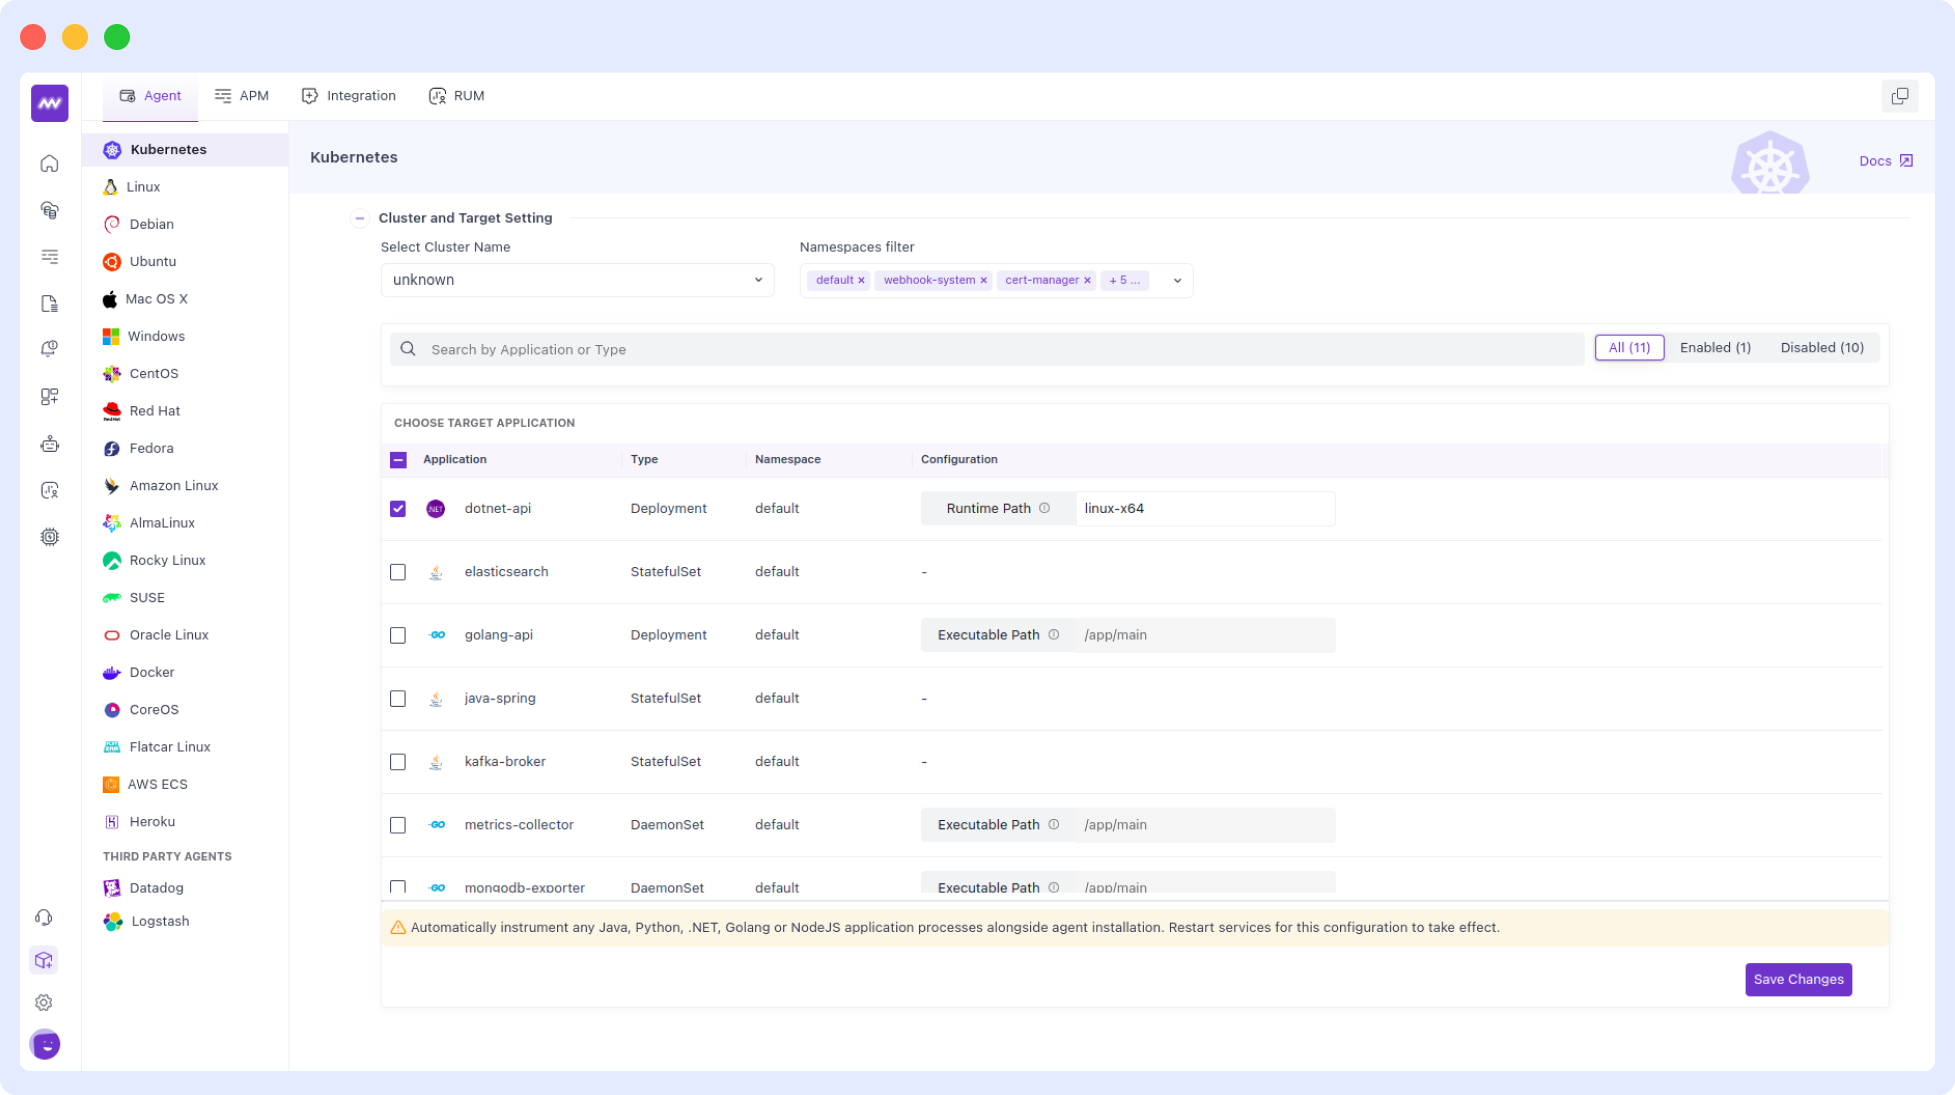
For each application, you can see:
- Application name.
- Workload type (Deployment, StatefulSet or Daemonset).
- Programming language (automatically detected).
- Current instrumentation status.
Applying Changes
Auto-instrumentation applies to Deployments, DaemonSets, and StatefulSets. Ensure your application uses one of these resource types.
After making changes to your instrumentation configuration:
Click "Save Changes" to apply your configuration.
Restart the affected applications for the changes to take effect. Example:-
kubectl rollout restart deployment <deployment-name> -n <namespace>
Core Components
OpenTelemetry Operator: The foundation of the auto-instrumentation system
- Manages the lifecycle of OpenTelemetry instrumentation.
- Handles the injection of instrumentation agents.
- Integrated as a dependency in the Middleware Helm chart.
Middleware-Specific Components:
- Language Detector: Automatically identifies the programming language of your applications.
- Auto-injector Webhook: Mutates pod specifications to add necessary instrumentation annotations.
These components work together to:
- Detect application languages automatically.
- Apply appropriate instrumentation configurations.
- Manage the lifecycle of instrumentation agents.
- Provide visibility through the Middleware UI.
Verification
To verify that auto-instrumentation is working:
- Check the auto-instrumentation pods:
kubectl get pods -n mw-autoinstrumentation
- Check the detected applications in the Middleware UI. Verify that they are enabled and have been restarted.
- Check application logs for instrumentation messages.
- Monitor your applications in the Middleware APM section.
If your application has special requirements and you need custom instrumentation settings, or just want total control over the instrumentation of apps in your kubernetes clusters, it is best to use manual configuration. See the customization page for details on how to manually configure instrumentation.
Explore your data on Middleware
Once the auto-instrumentation setup is complete and the relevant Pods are restarted, the data should start flowing to Middleware for any new requests made to your applications. You can explore APM traces data by going to the APM section of your Middleware account.
Uninstall
Uninstall cert-manager and middleware autoinstrumentation setup
This will remove the mw resources , OTel Kubernetes Operator AND cert-manager (including one you installed previously) from your cluster. Ensure that this is what you want to do.
helm uninstall mw-auto --namespace mw-autoinstrumentation

helm uninstall cert-manager --namespace cert-manager
Uninstall only middleware autoinstrumentation setup
If you wish to keep cert-manager and only uninstall middleware autoinstrumentation setup, issue the command below
helm uninstall mw-auto --namespace mw-autoinstrumentation
Uninstall cert-manager and middleware autoinstrumentation setup
This will remove the mw resources , OTel Kubernetes Operator AND cert-manager (including one you installed previously) from your cluster. Ensure that this is what you want to do.
MW_UNINSTALL_CERT_MANAGER=true MW_API_KEY="<MW_API_KEY>"
bash -c "$(curl -L https://install.middleware.io/scripts/mw-kube-auto-instrumentation-uninstall.sh)"
Uninstall only middleware autoinstrumentation setup
If you wish to keep cert-manager and only uninstall OTel Kubernetes Operator, issue the command below
MW_API_KEY="<MW_API_KEY>"
bash -c "$(curl -L https://install.middleware.io/scripts/mw-kube-auto-instrumentation-uninstall.sh)"
Using Google Kubernetes Engine
If you are using GKE private cluster, you must add a firewall rule that allows your GKE control plane CIDR block access to port 9443/tcp on worker nodes.
Use the command below to find out GKE control plane CIDR block
gcloud container clusters describe <CLUSTER_NAME> \
  --region <REGION> \
  --format="value(privateClusterConfig.masterIpv4CidrBlock)"
- Replace
<CLUSTER_NAME>with the name of your cluster. - Replace
<REGION>with the region of your cluster.
For example,
gcloud container clusters describe demo-cluster --region us-central1-c --format="value(privateClusterConfig.masterIpv4CidrBlock)"

# Example output: 172.16.0.0/28
Then you can add a firewall rule to allow ingress from this IP range and TCP port 9443 using command below
gcloud compute firewall-rules create cert-manager-9443 \
  --source-ranges <GKE_CONTROL_PLANE_CIDR> \
  --target-tags ${GKE_CONTROL_PLANE_TAG}  \
  --allow TCP:9443
<GKE_CONTROL_PLANE_CIDR> and <GKE_CONTROL_PLANE_TAG> can be found by following the steps in the GKE firewall docs.
More information can be found in the Official GCP Documentation. See the GKE documentation on adding rules and the Kubernetes issue for more detail.
Any issues?
If you encounter any challenges, check our troubleshooting page for how to fix them.
If you encounter any problems not listed on our troubleshooting page, please contact Middleware support on Slack. Include your debug logs and config info (with sensitive information removed)