Application Performance Monitoring
APM traces a request across every service it touches, then keeps the profile, the logs and the host metrics attached to that same trace. You instrument once per service — with an agent for most languages, or manually where no agent exists — and the correlation comes from request context, not from you tagging things by hand.
APM Use Cases
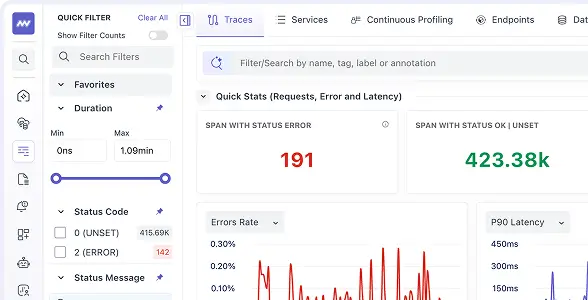 Configure ApplicationInstrument a service and choose what it sends
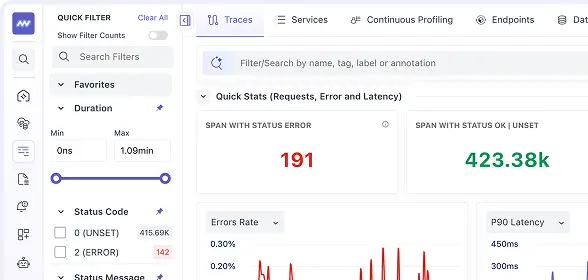 TracesFollow one request across every service it touches
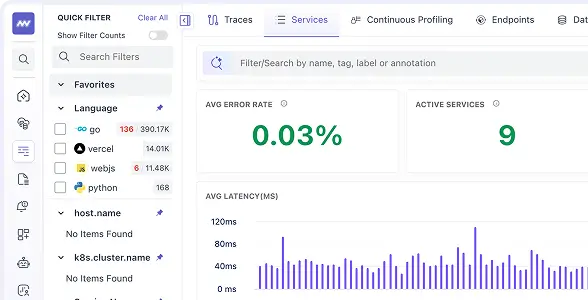 ServicesMap dependencies and spot slow or failing services
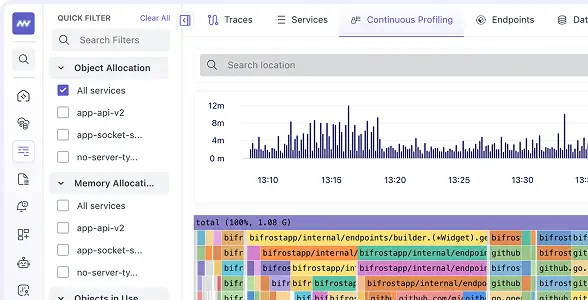 Continuous profilingFind the functions using the most CPU and memory
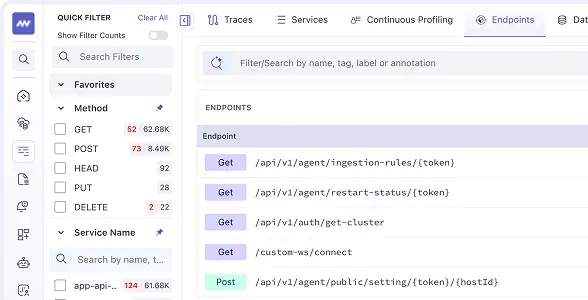 Endpoint monitoringDiscover API endpoints and track latency and errors
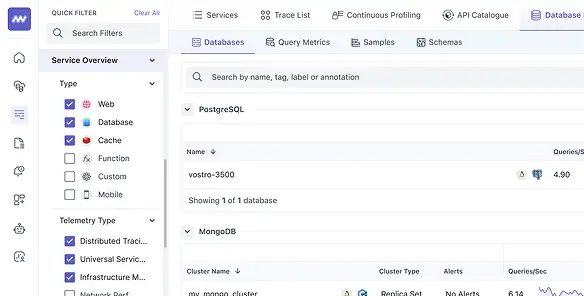 Database monitoringSee the queries and calls slowing your services
Related Features


What did you think of this content?